FAQ
1) How to hold the CORNET meter for measurement?
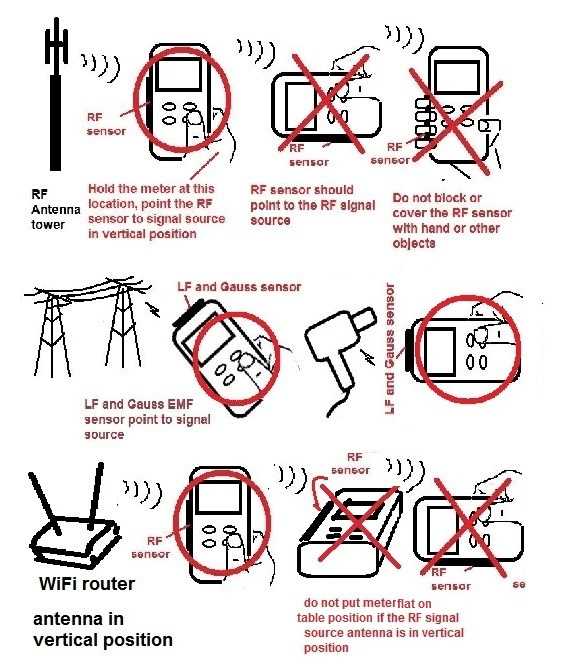
The CORNET meter has three internal sensing antenna built in to measure the received signal; the user should not cover or block the sensor area of the meter while measuring. The location of the sensors is indicated on the meter's back silver label. The CORNET meter is a single axis meter; please rotate the meter to get the maximum reading direction and follow that direction while measuring. (Only a single axis meter can find the direction of the signal source.) The meter has three operation modes (RF, LF Gauss, and LF Electric field); please follow the directions in the picture below while doing the measurement.
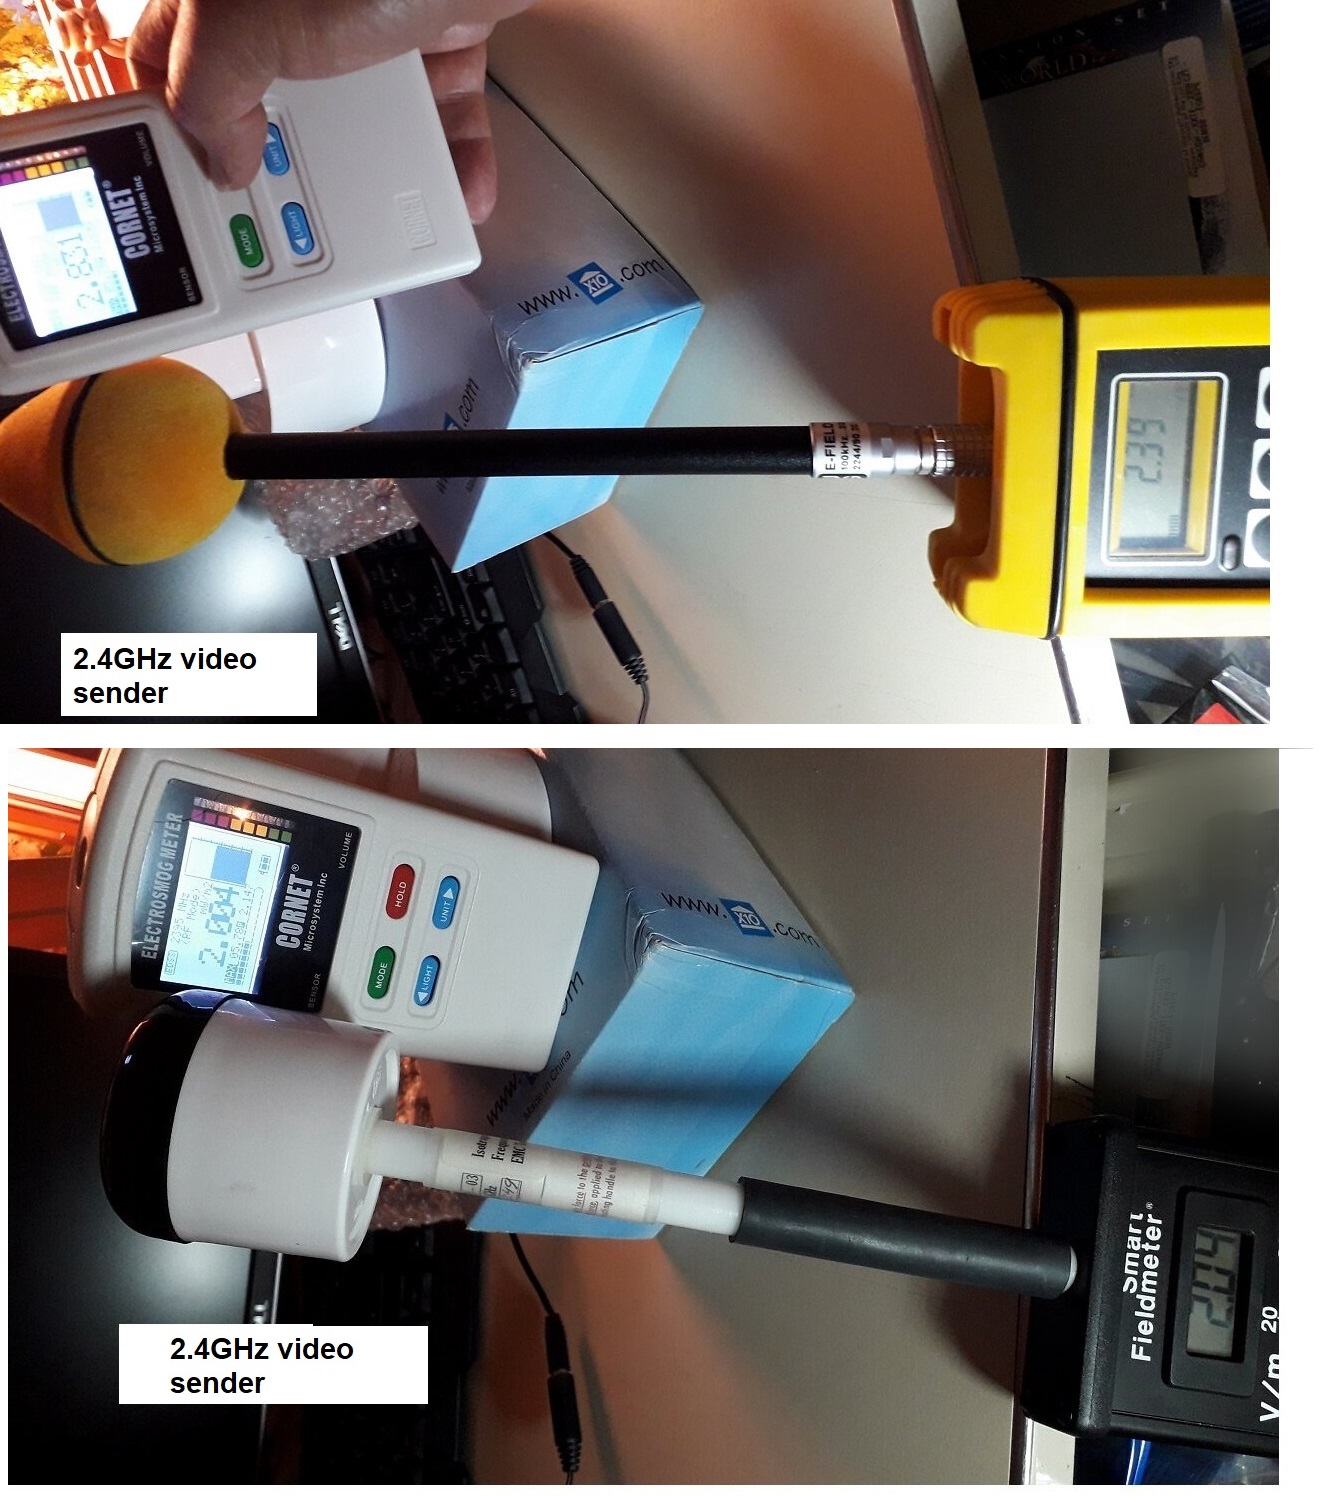
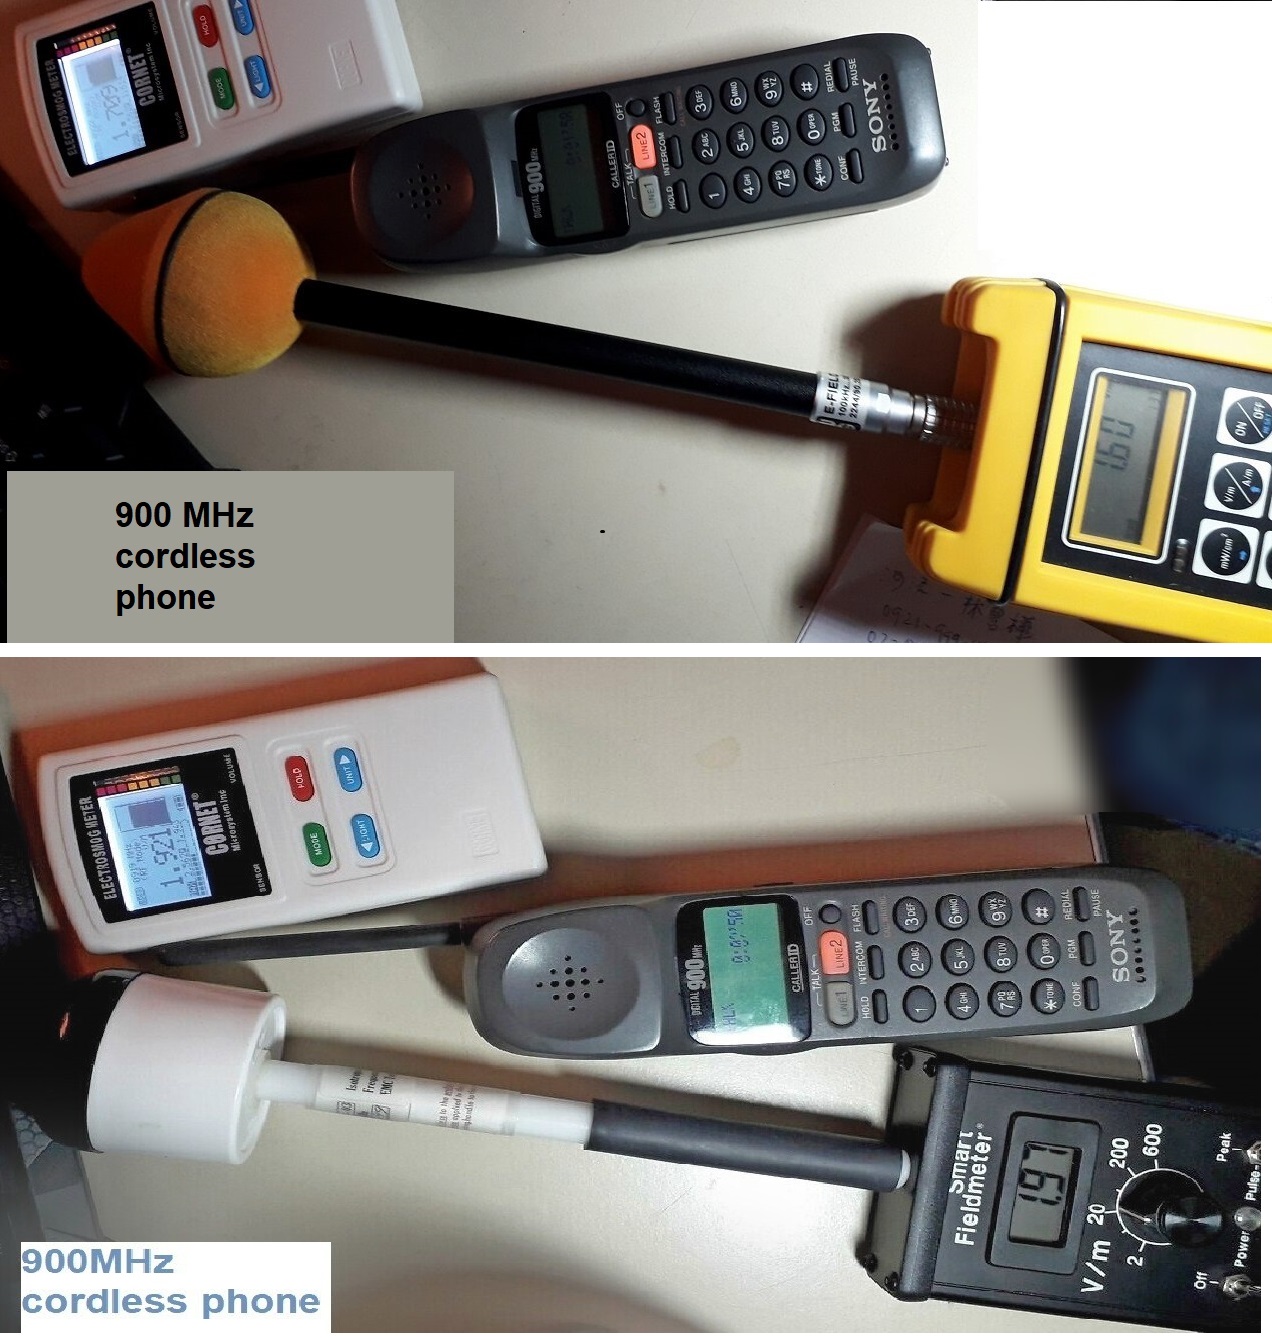
2)What is the best measuring distance between the RF source and the meter?
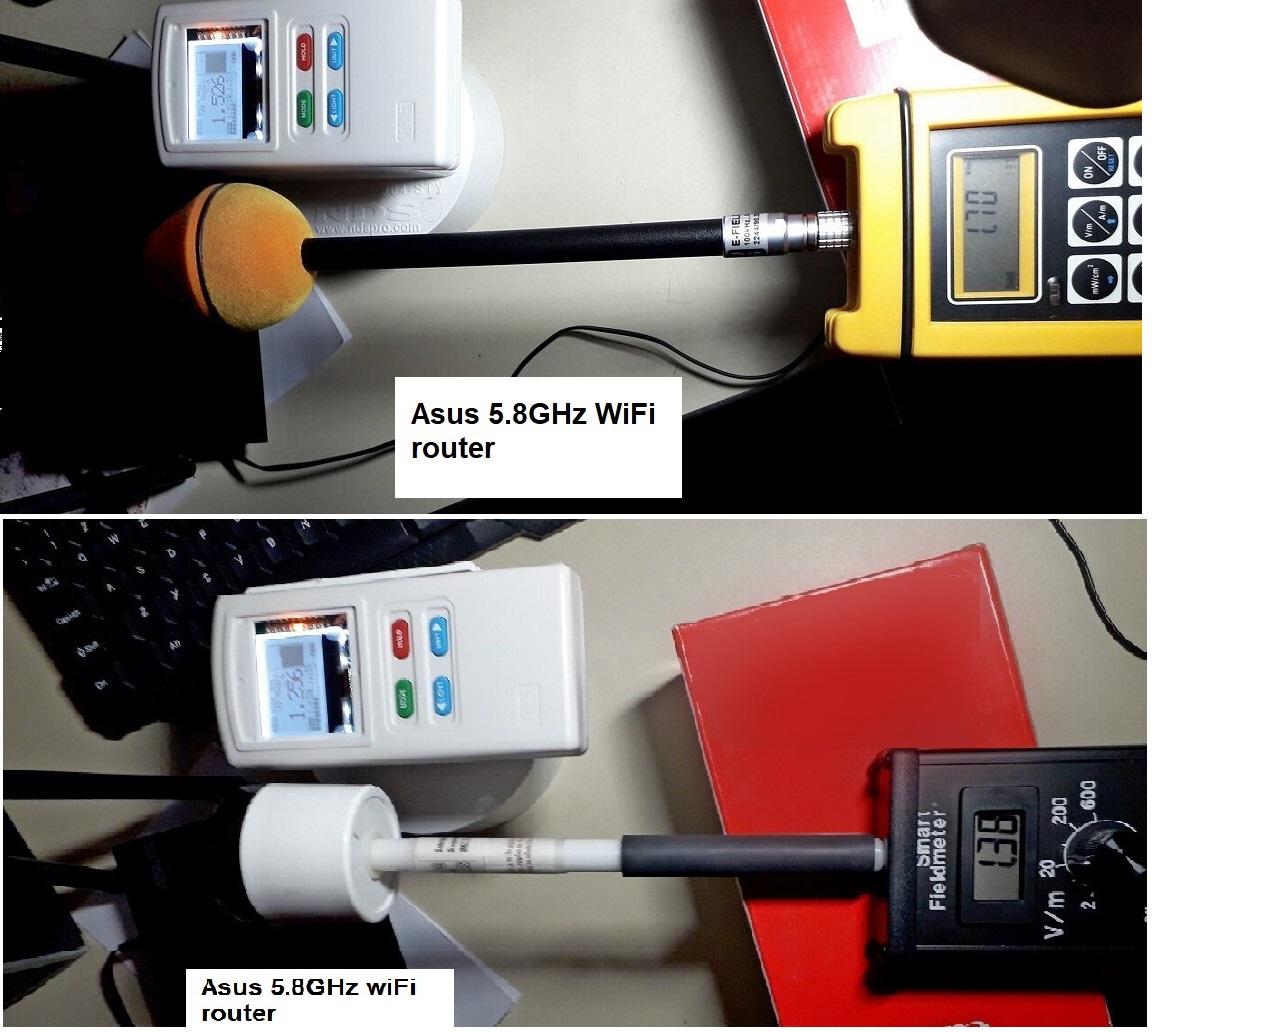
The majority of RF safety standards required a minimum measurement distance of 1 meter or 3 meters from the source of the RF signal; otherwise, the meter will become overloaded (such as RF transmitter or WIFI router which radiates very high RF power from its transmit antenna).
If the meter is placed too close to or right next to the transmit antenna, the frequency counter feature of the meter will also get overloaded.
For mobile phone antenna tower measurement:
The area between 50 and 300 meters from the antenna tower is the one with the largest radiation risk
When the distance was extended, the RF radiation rapidly reduced ( by distance square)
The RF transmit power to the transmit antenna on the tower also affect the radiation level as well.
Radiation power density (mw/m2)= RF transmit power(mw)/4πR2 where:R is distance from RF source
*A highly recommended resource on cell tower radiation may be found at: http://www.buergerwelle.de/assets/files/workshop on cell tower radiation.pdf
3) Accuracy of the meter?
Each CORNET meter is calibrated in our USA lab using certified test equipment before being shipped to our customers.
We also compare the meter's reading to that of an industrial standard certified professional EMF meter from companies like Narda and Smartfield meter to make sure it is correct. The meter store the Calibration data inside the meter's memory, therefore it is not required to re-calibrate the meter from time to time.
4)What is the Maximum frequency the ED88TPlus series meter can operate?
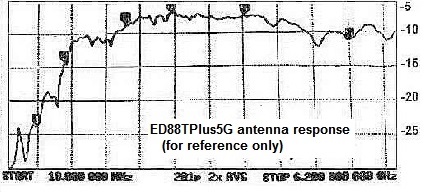
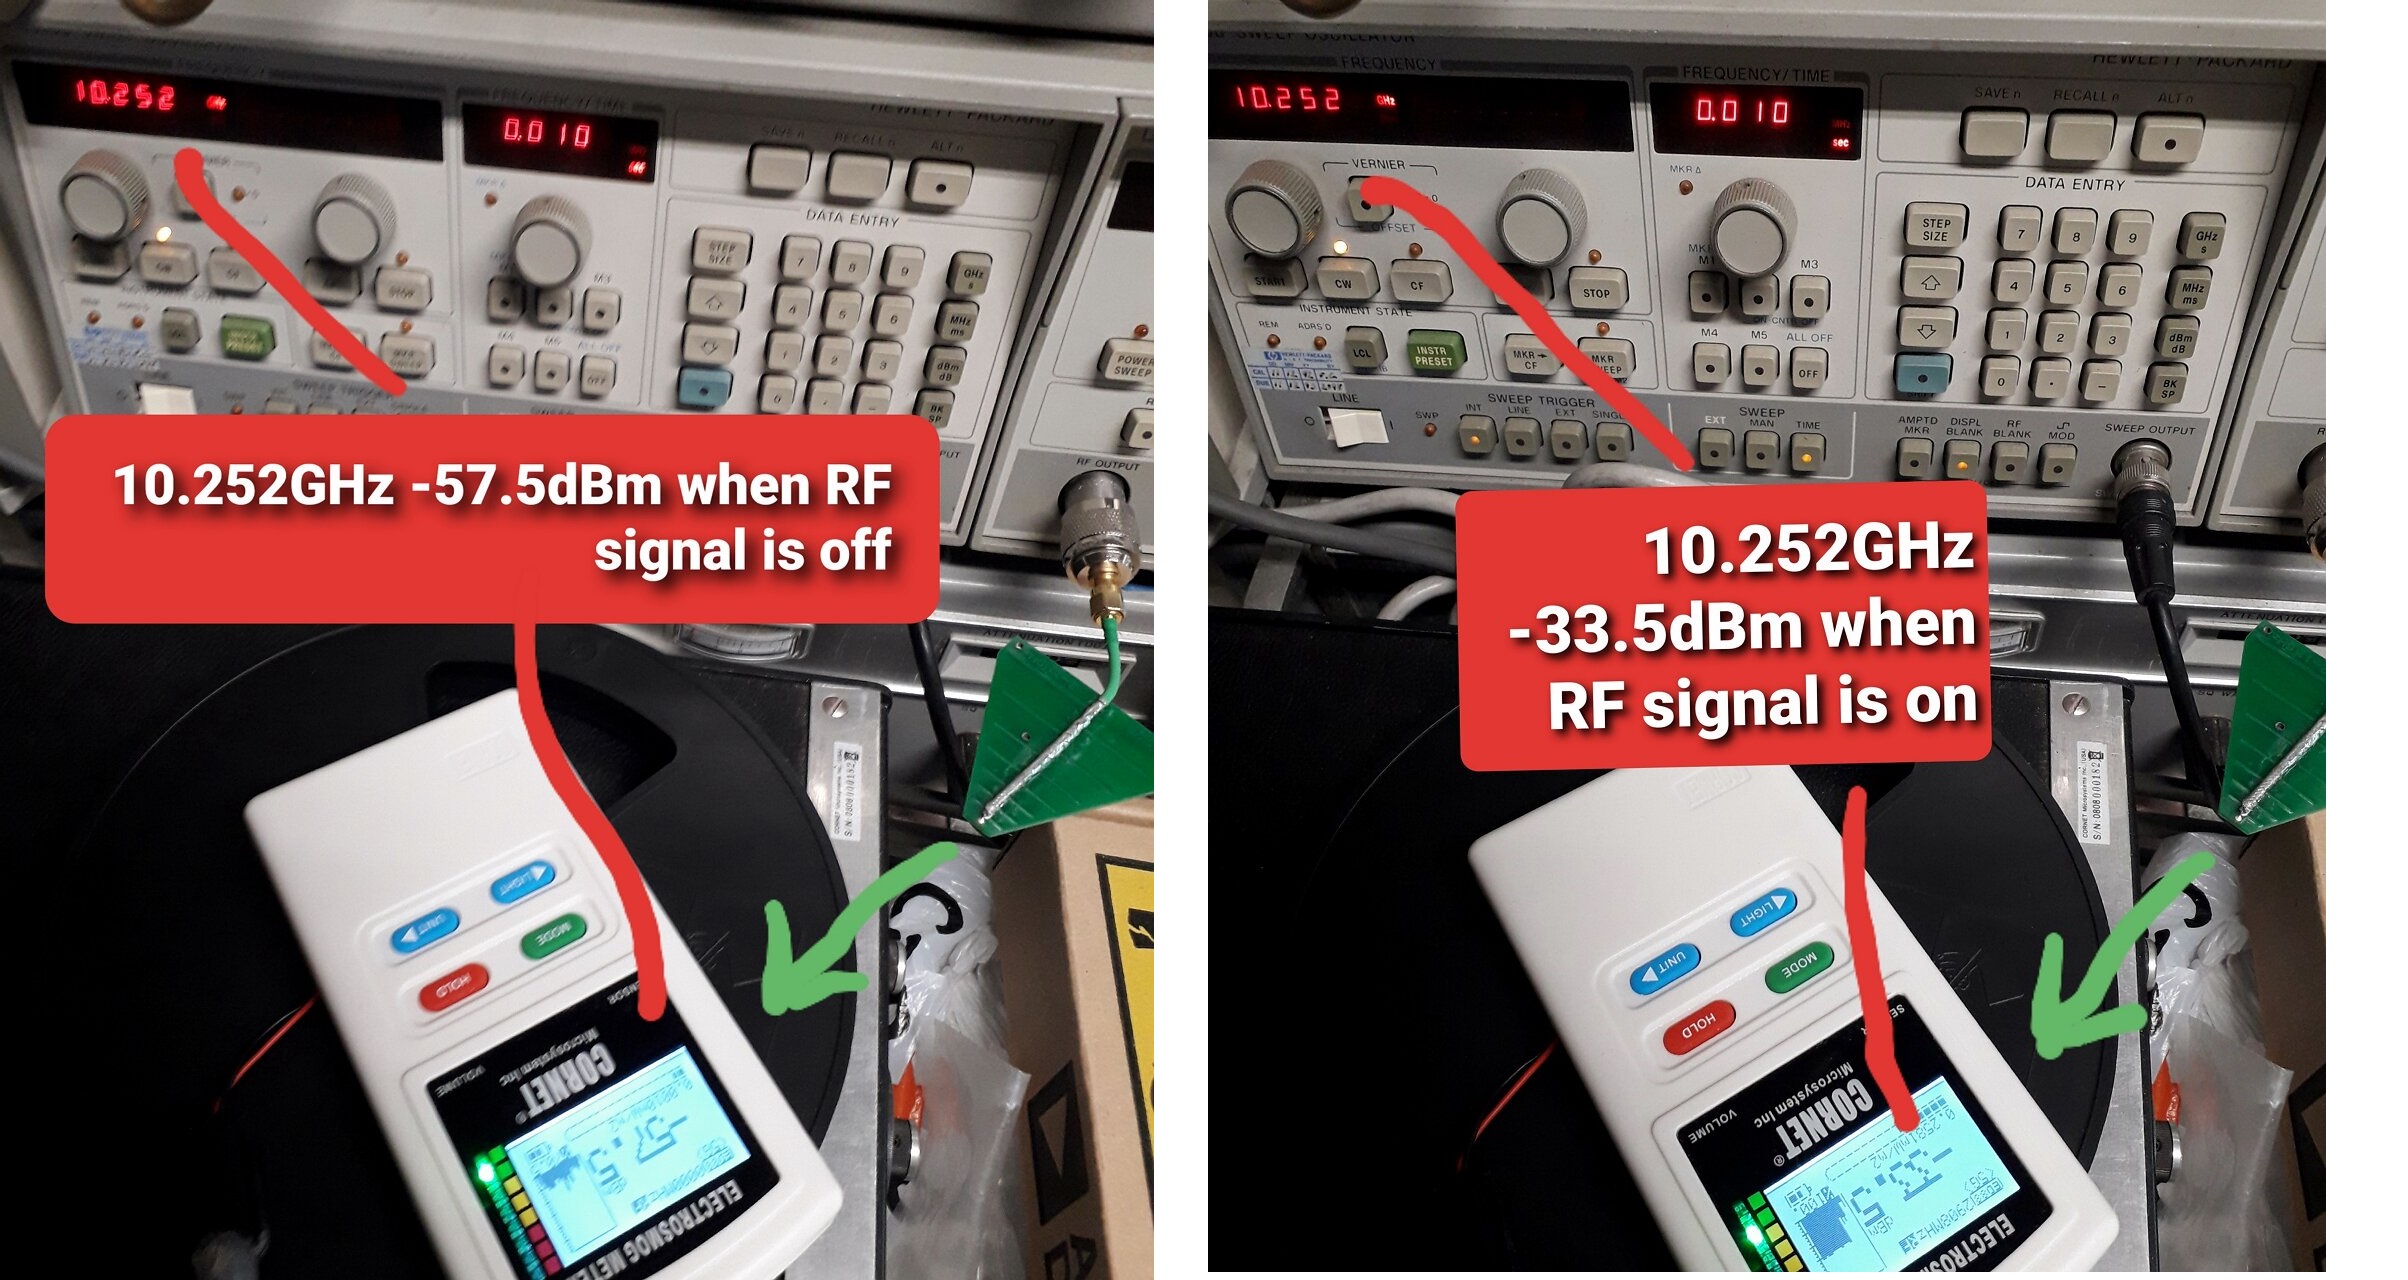
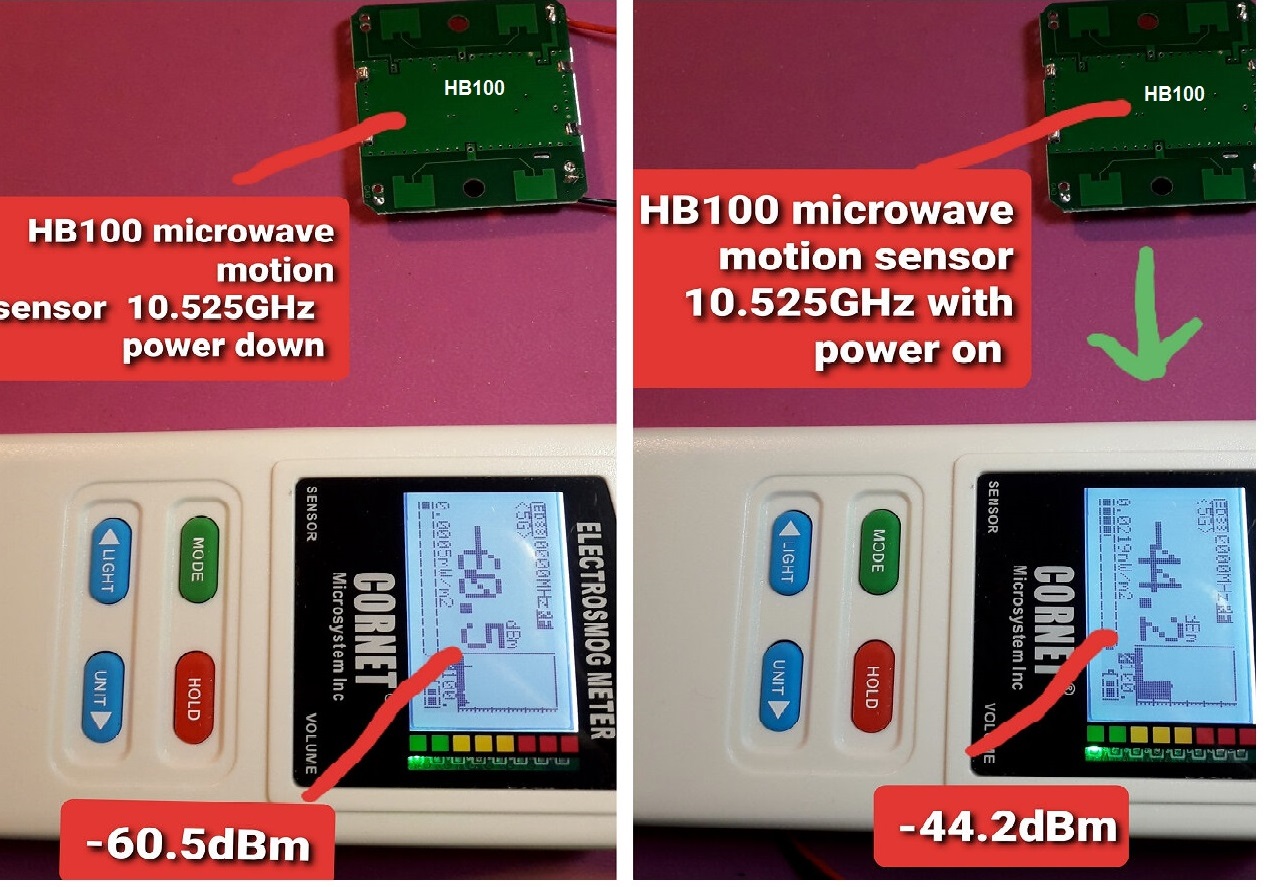
The ED88TPlus5G and ED88TPlus2 meters have an 8GHz specification, but they are found to work up to 11GHz with reduced sensitivity.(Uncalibrated) as a detector purpose, such as detecting a microwave motion sensor for LED light control detection. (For better sensitivity the ED85EXPlus meter with LPDA1810 external antenna unit is recommended)
* Remember that the air loss of a high band microwave signal is very large; most devices at that frequency operate at a signal level of -80dBm to -100dBm; you may need to place the meter very close to the signal source to detect it.
5)What is the Frequency counter function of the ED88TPlus series meter ?
Real time Frequency counter display
The CORNET ED88TPlus series meter is currently the only meter on the market with a built-in frequency display function.
The ED88TPlus series meter's Frequency display function is a real time frequency counter; the meter measures both the RF signal level and the frequency of the received signal at the same time, down to each pulse/burst level ( the pulse/burst can be as short as 100usec).
The ED88TPlus5G frequency counter operates up to 4.2GHz, covering all 5G mobile network frequency bands (except the millimeter wave band), while the ED88TPlus2 and previous models of CORNET meters operate up to 2.7GHz.
Based on the frequency of the signal, the user can determine the source and type of the RF signal.
(for example: Wifi use 2.4GHz, DECT phones use 1.9GHz, 4G cell phones use 1.7GHz-1.9GHz, cordless phones, IOT devices use 900MHz, and 5G mobile network uses 3.5GHz....) Once the signal source type is known, it is very easy to find a way to reduce the RF radiation level.
(*A minimum signal level is required to correctly detect the frequency of the signal.)
6) The difference between RF power (dBm, mw) and RF power density (mw/m2) ?
-The dBm or mw is the unit of the received RF power. (0dBm=1mw)
-The mw/m2 is the unit of the RF power density which is related to the RF field strength.
-The RF power density (mw/m2) is the received RF power (mw) divided by the area (m2) of the the effective area of the meter's receiving antenna.
For example: tne meter's antenna received the RF power of -25dBm, after divided by the effective area of the receiving antenna (m2) we got the power density or field strength of 1.8mw/m2
The effective area of the receiving antenna is different for different antenna or meter design.
If you are measuring RF field strength you use the unit of RF power density (mw/m2)
If you are measuring received RF power you use the unit of RF power (dBm)
*most of the RF engineer uses dBm because the RF transmitter output, antenna loss, on air loss, distance loss, and frequency loss etc., ... are all specified as dB or power of dBm. ( the meter's received RF power is the RF source tranmitted power minues all these loss).
7) Compare Frequency counter to the Spectrum Analyzer?
Spectrum Analyzer problems in modern digital RF environment
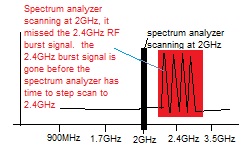
The modern digital RF signal utilized in mobile phones, Wifi, and new wireless devices is a pulse/burst kind of RF signal. It transmits signals in extremely short bursts but does not send any signal in between the pulses/bursts; the RF pulse/burst has a very high signal level while bursting, and practically little signal during non-bursting time. The classic scanning method of Spectrum analyzer has a very sluggish scanning speed because it scans each frequency of the covered frequency spectrum step by step. It displays the frequency when the incoming signal frequency is matched with the spot scanning frequency of the Spectrum analyzer.
It is a "Hit or Miss!" procedure. It is fine for old continuous wave analog RF signals, but not for modern digital RF pulse/burst type of signals.
The classic scanning type of Spectrum Analyzer simply cannot record the receiving on and off RF burst in time (It will take several seconds to scan from low frequency of spectrum to high GHz of spectrum in old scanning type of Spectrum analyzer). Because the on-air RF signal is asynchronous to the spectrum analyzer's scanning operation, the Spectrum analyzer will miss burst signals most of time.
The only method to avoid the issues is to repeatedly scan the full frequency spectrum again and again then overlay the findings in the goal of obtaining a complete image of the spectrum of the signal received. Most of the time, this is not very effective because the digital RF transmitted signal bursts are time dependent and never repeat themselves like continues wave analog RF signals, If the Spectrum analyzer fails to capture it at the scanning frequency in time, the RF burst signal is gone and the Spectrum analyzer will never able to capture it again and show the frequency of it.
To solve the problem, modern Real-time Spectrum Analyzer captures sections of the frequency spectrum all at once and then display the spectrum using digital signal processing methods, but it is very expensive and bulky equipment, the bandwidth of the section of frequency that the real-time Spectrum Analyzer can capture each time currently is also very limited.
The slow scan speed of Spectrum analyzer can not capture the fast on/off pulse/burst of the modern digital RF signal in time. The real time frequency counter in the ED88TPlus series of meter is the best solution for the modern digital RF signal problems.
The ED88TPlus5G meter captures signals at a rate of 25000 samples per second, allowing it to record digital RF signal pulses and bursts as short as 100usec. Each pulse/signal burst's level and frequency are recorded in real time. You always get the correct signal level and frequency of the signal pulse/burst.
* (The frequency counter circuit requires a certain minimum signal level to function properly.)
8) 5G mobile frequency indicator?
5G mobile frequency frequency indicator =5G=
The ED88TPlus5G meter frequency counter display supports frequencies up to 4.2GHz. The meter automatically detects the 5G mobile network frequency bands signal and displays a =5G= mark on the display to indicate the detection of the 5G mobile network frequency. (5G channel n5, n71, n77, and n78)
(*A minimum signal level is required to correctly detect the 5G signal.)
9) How to use the ED88TPlus5G to measure the 5G signal?
The 5G mobile network can transmit data at super-fast speeds. However, it consumes a lot of bandwidth from the system, limiting the number of services that can be provided at the same time. There are two types of 5G network systems: SA (standalone) and NSA (no-standalone). The SA system employs a pure 5G network system and frequency. The NSA system combines the older 4G-LTE system and frequency with the new 5G network system and frequency as a hybrid system.
Because the SA system is very expensive, 99 percent of the world's 5G mobile networks are now using the NSA 5G system..
When a mobile handset attempts to connect to a 5G antenna tower-based station, the NSA 5G system uses the older 4G-LTE frequency band for the protocol handshaking phase. and it only transmits super high-speed data using the 5G system/frequency band during the 5G data download phase. It is done dynamically. If the based station decides that the 5G signal is not good enough or is too busy, the NSA 5G system may not use the 5G system/frequency at all in the data download phase of transmission. Instead, it may use the older 4G-LTE system/frequency for data download phase transmission. As a result, the 5G network signal will not be visible in the NSA 5G system all the time.
You may not be able to detect the 5G signal/frequency in front of the 5G antenna tower in the NSA 5G system, unless someone in the area is using the 5G phone talking to the antenna tower base station, and is in the 5G data download phase using the 5G signal/frequency.
The ED88TPlus5G has a built-in frequency counter and 5G frequency indicator that supports all 5G frequency bands*. It will detect and display the 5G signal frequency when the NSA 5G system transmits the 5G signal with the 5G frequency during the 5G super high speed data download phase.
Other meters without a frequency counter function will not be able to tell you whether you are measuring an old 4G/LTE signal or a new 5G signal.
*except the millimeter wave band
10) Statistical Data & Realtime signal waveform window of the received RF signal in ED88TPlus5G & ED88Plus5G2?
Modern digital RF signals are pulse/burst signals with a very high on-time burst signal and almost no signal in non-bursting time. It is different from the traditional continuous wave analog type of RF signal.
Today, the majority of wireless devices use digital RF signals.
The "Average value" of the signal level used by the transitional EMF meter or RF power meter to display the level of a continuous wave RF signal does not work well for modern digital RF signals, because the digital RF signal changes on and off so fast that the "average value" can no longer show the actual behavior of the signal measured.
The majority of the professional RF power meter is now operate in peak power meter mode. It displays the peak level of the RF pulse/burst signal. EMF safety research is also expanding into the digital RF field.
Is the peak value is good enough for the modern digital RF signal measurement?
Since the ED15 meter, the CORNET meter has been a peak power meter. But, is the peak value reading adequate for modern digital RF measurement? The answer is no, not really! The modern digital RF signal burst is changing so fast that you can have several thousands of RF burst signals coming during the standard 0.5sec LCD screen update period. A single peak value of an RF pulse/burst signal among thousands of pulse/burst signals cannot represent the true behavior of the received signal. It required Statistical data from all of these thousands of pulse/burst signals to show the actual behavior of the received signal.
(* Why is the screen updating time 0.5 seconds? It is the shortest amount of time that the human eye can keep up with the fast-changing reading on the LCD display screen. You can't read it well if the screen updates faster than 0.5 seconds.)
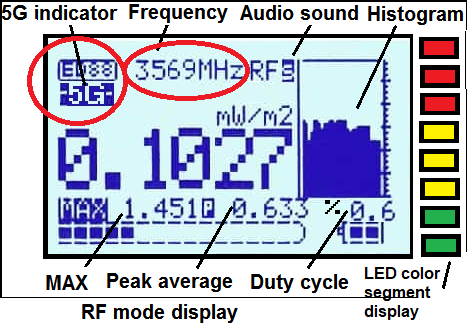
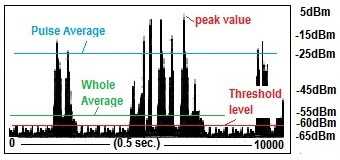
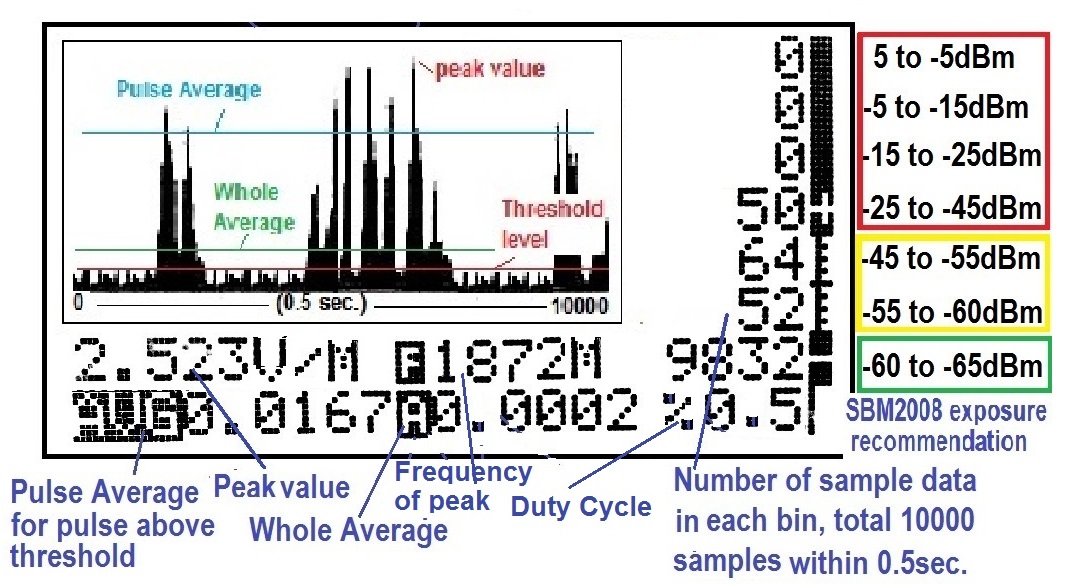
1) The ED88TPlus5G meter samples the signal at a rate of 25000 samples per second, with 12500 samples available for each 0.5second screen update period. 12500 samples are divided into seven bins (+5 to -5dBm, -5 to -15dBm, -15 to -25dBm, -25 to -45dBm, -45 to -55dBm, -60 to -65dBm). It shows the actual real-time signal level distribution within 0.5 seconds and is very useful for analyzing digital RF signals with short burst/pulse ON-time signals and long zero/very low level OFF-time signals.
The 7 sample bins are organized according to the SBM2008 exposure recommendation, and the calculated Peak Value, Whole Average Value, Peak Average Value, MAX value, and Average Pulse-power value are also shown on the same display window.
(* The Average Pulse-power value is the average of all signals above the -60dBm threshold level (0.0005mw/m2, "slight concern" based on the SBM2008) ; it is the average ON-time power of all RF burst/pulse for digital burst/pulse type of RF signal).
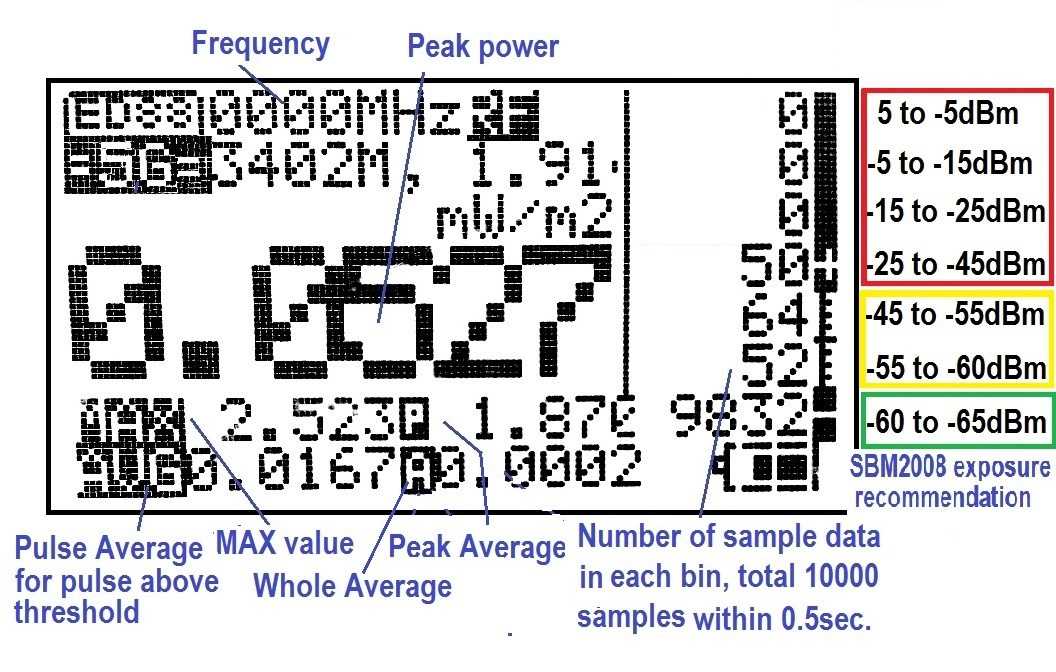
For example: in the graph below, 9832 samples are below -60dBm and 50 samples are between -25dBm and -45dBm.
(*The number in the Statistical bins is scaled down by 1.25 to get a total of 10000 for 7 bins, so the user can calculate the percentage of signals in each level bin by dividing the number by 100, or simply ignore the last two digits of the number.)
As a result, 0.5 percent of the time the RF pulse/burst signal level is greater than -45dBm (SBM2008 exposure 0.01mw/m2 limit "high concern") and 98.3 percent of the time it is less than -60dBm (0.0005mw/m2, "slight concern" based on the SBM2008). This tell you that 98.3% of the time the RF radiation level is in the "slight concern" level (based on the SBM2008 recommendation), and only 0.5% of time it is in the high concern level. This is the information the information the EMF experts are looking for.
ED88TPlus5G Statistical data display
2) The ED88TPlus5G2 meter has additional Realtime signal waveform display of the detected signal with the Statistical data information. The realtime signal waveform is sampled at 42usec/sample and displayed in the Statistical data window with 500usec/step for 0.5sec. display update time. From the realtime signal waveWiFi Beacon signalform display the user can see the actual signal captured with the measured signal level and frequency. This is very important for identifing the digital RF burst type of signal used by 5G/4G LTE mobile phone, Wifi, DECT, Bluetooth...etc., devices to apply shielding solutions for safety purpose.
ED88TPlus5G2 Realtime signal waveform and Statistical data display
3) Typical Realtime digital RF waveform captured by ED88TPlus5G2
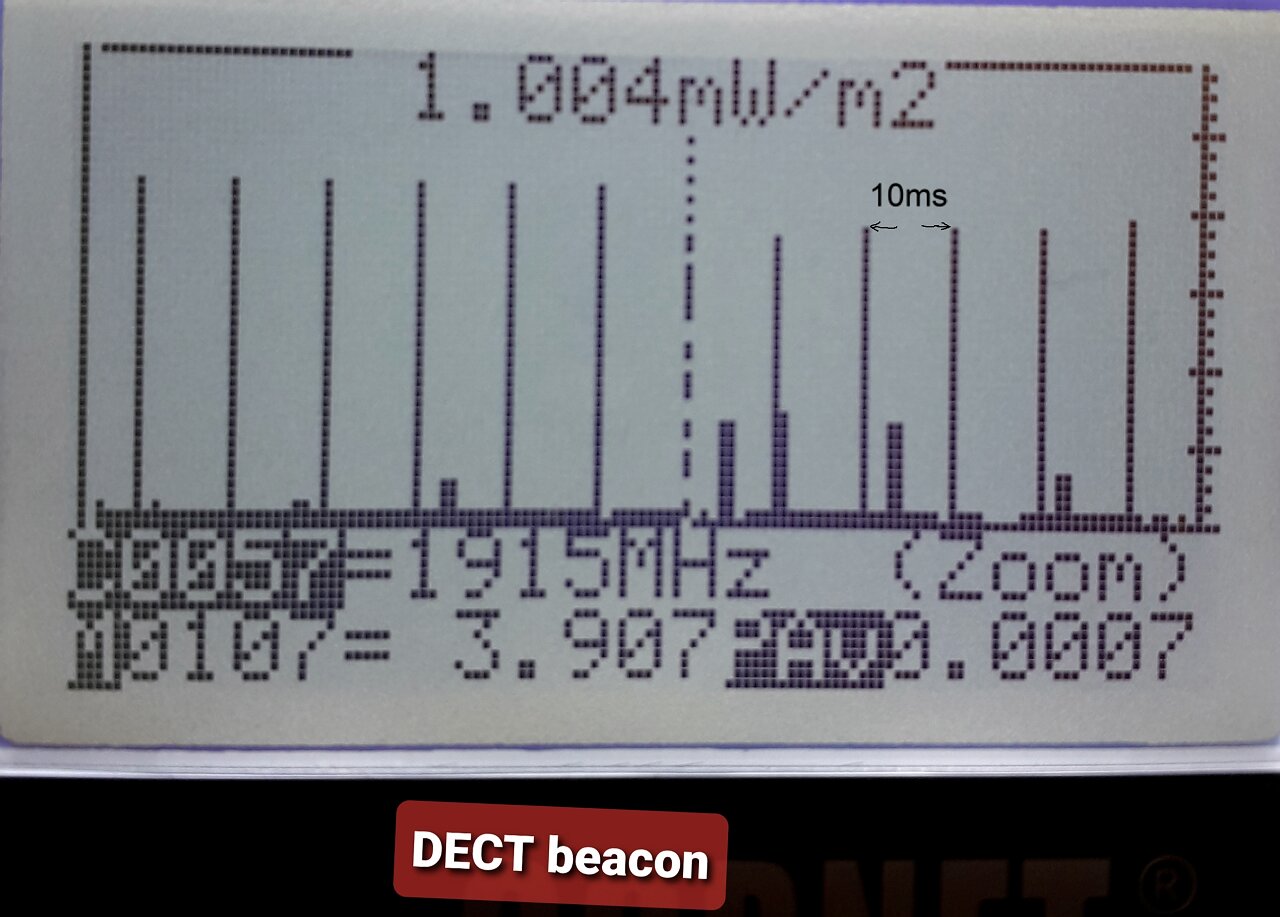
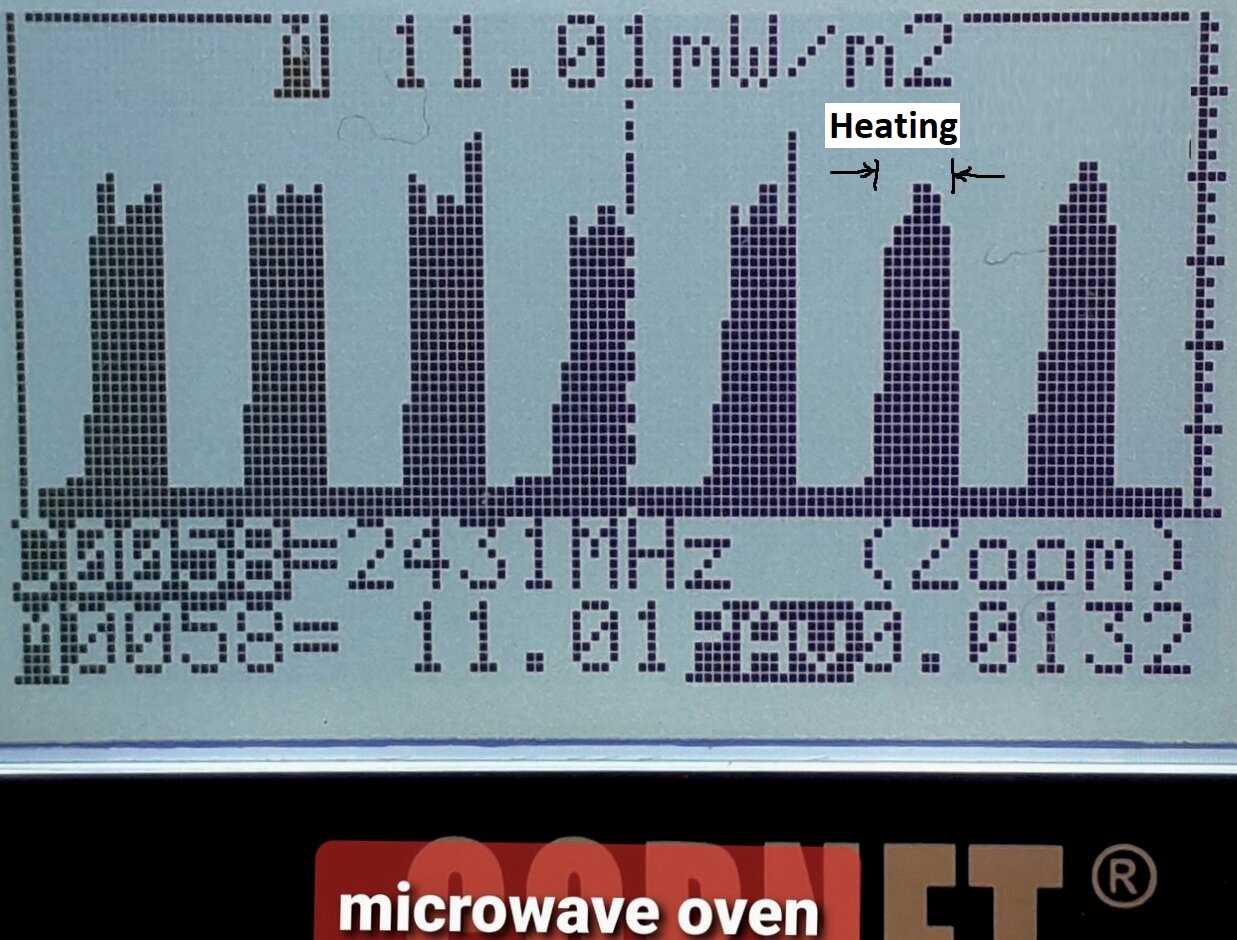
DECT Beacon signal every 10ms Microwave oven heating bursts
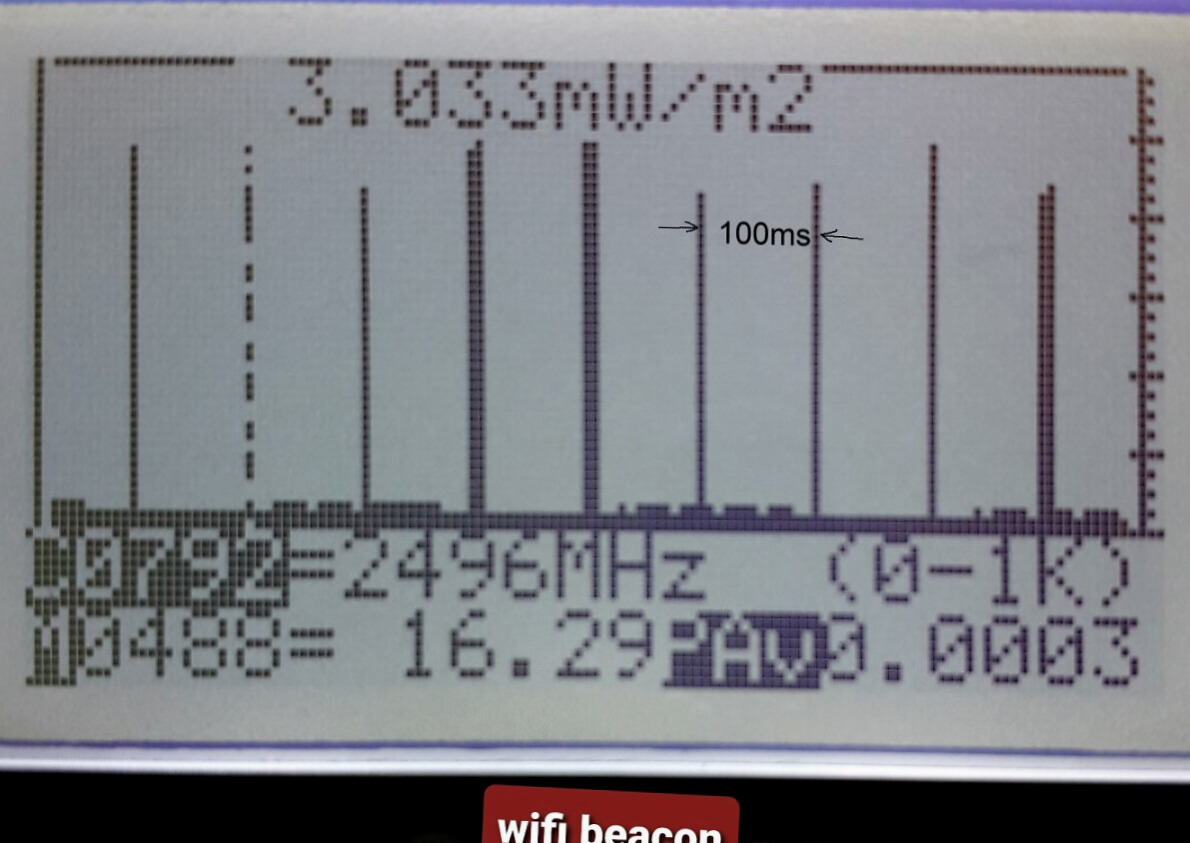
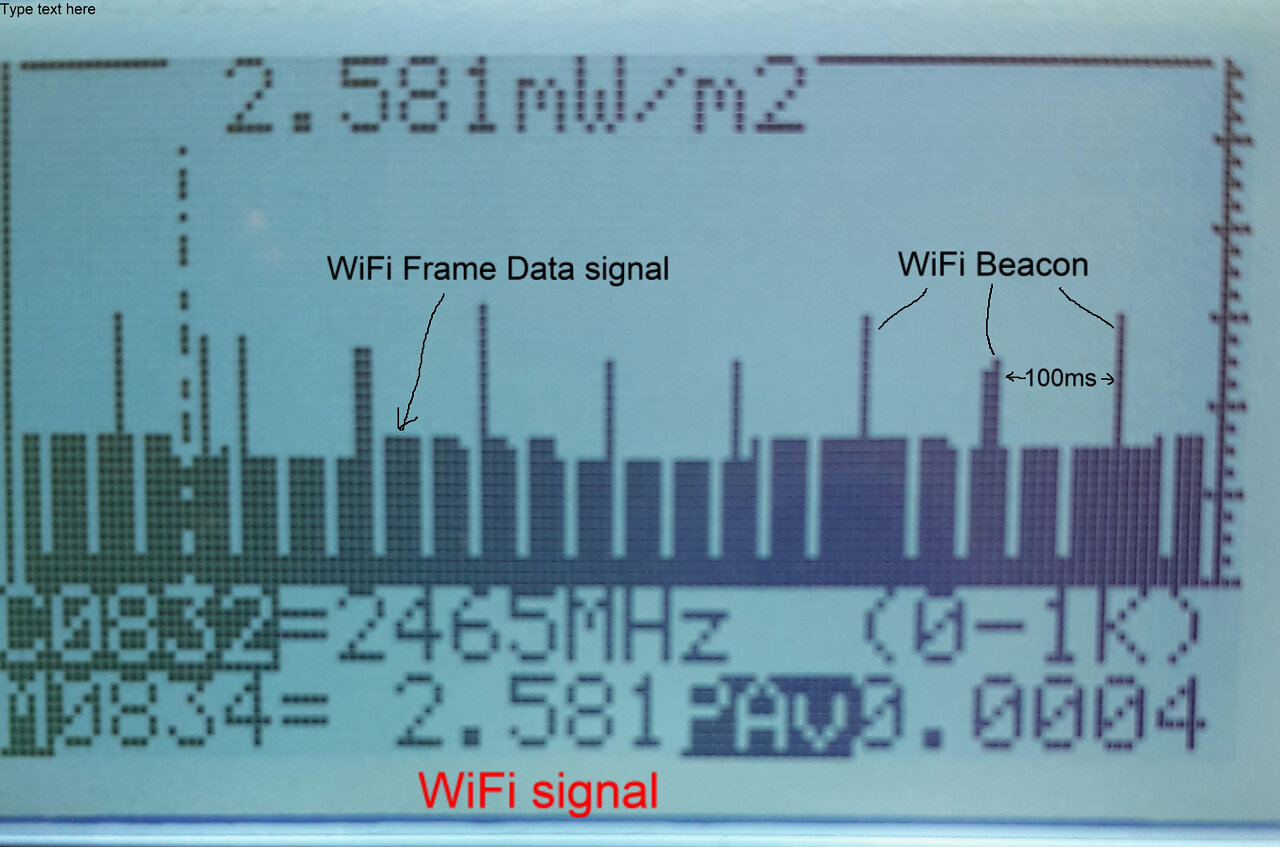
WiFi Beacon signal every 100ms WiFi Data frame signal with WiFi Beacon
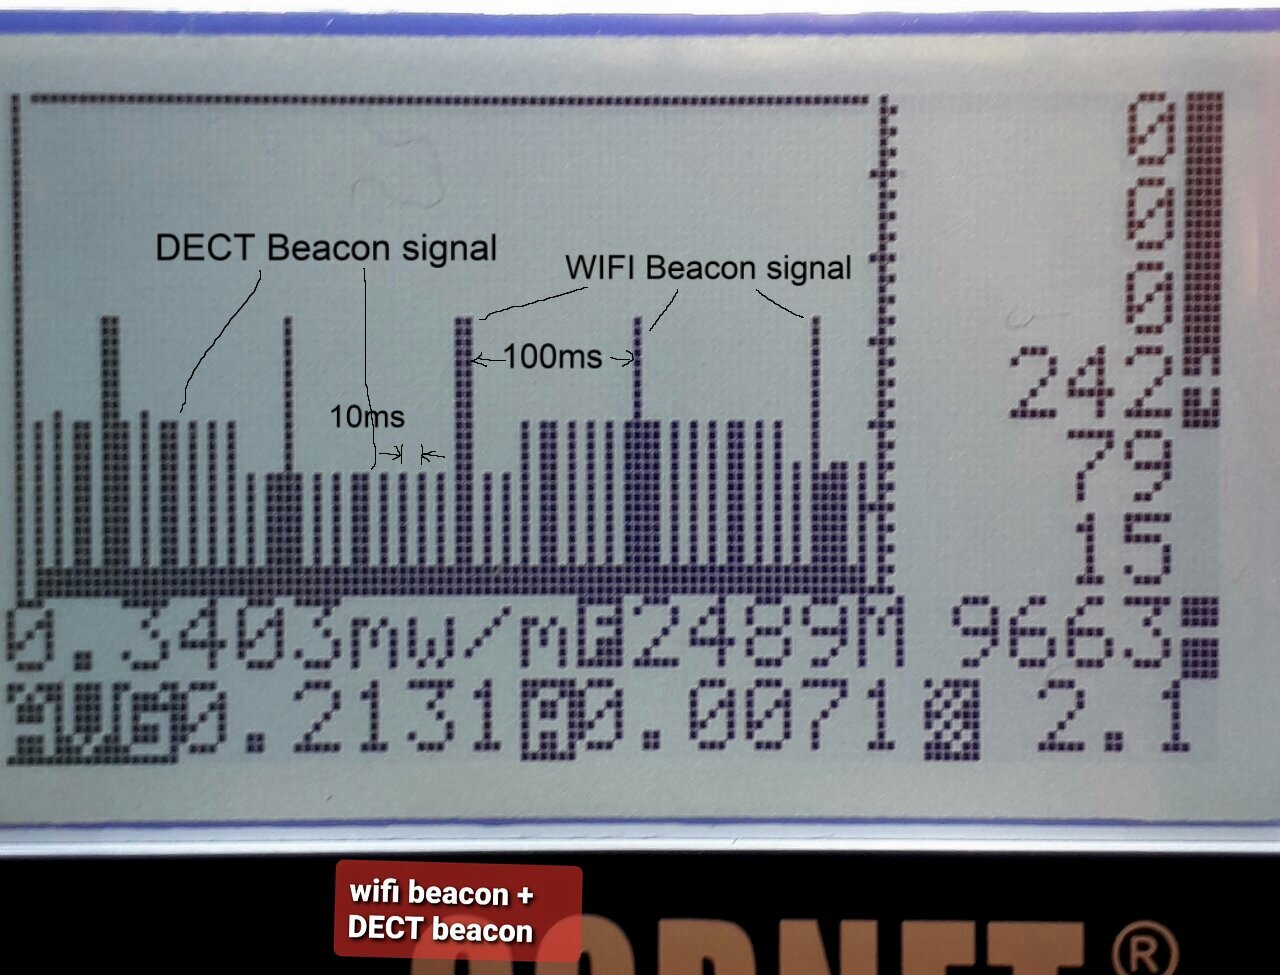
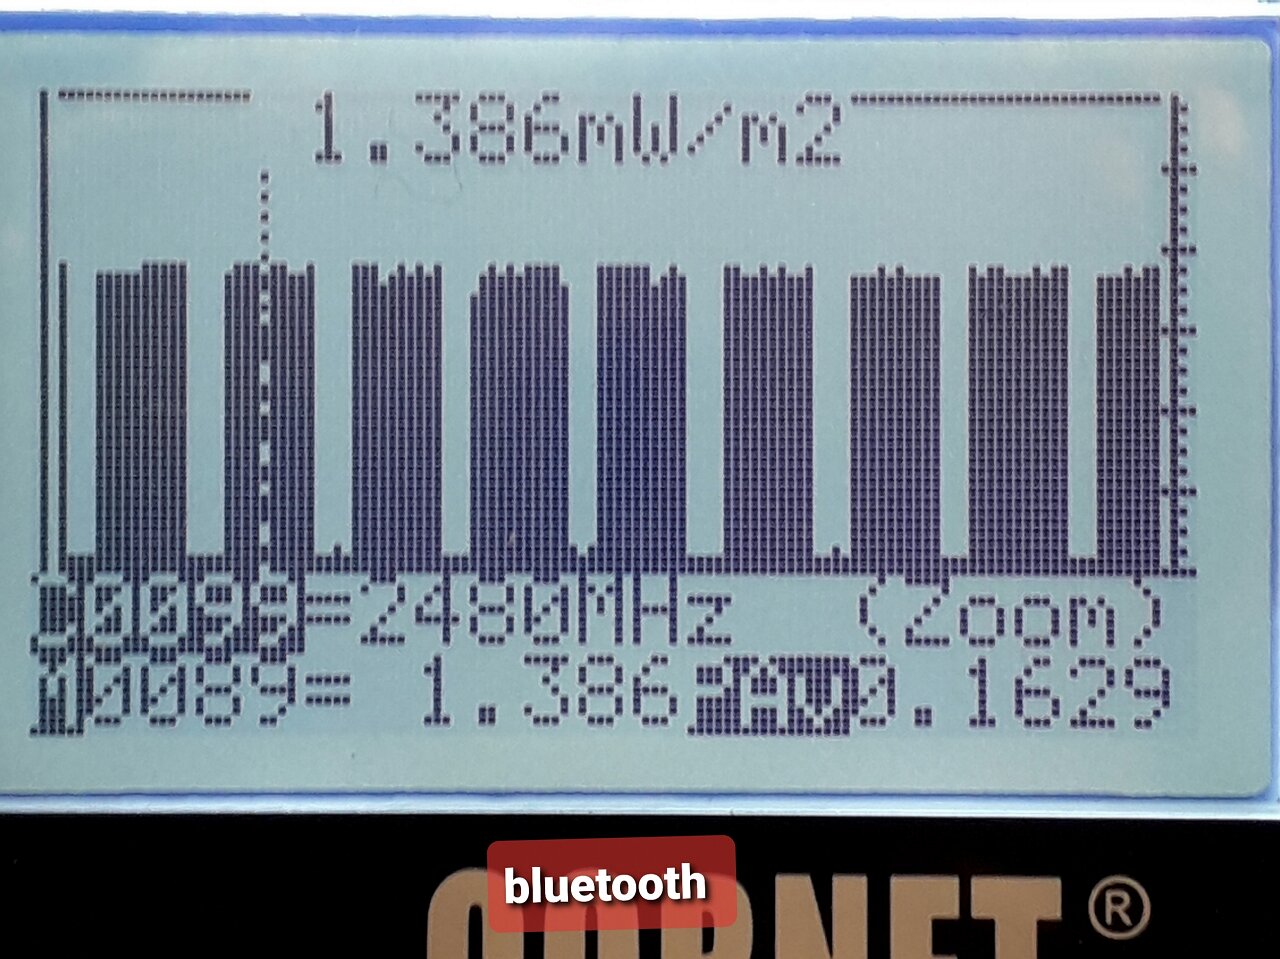
WiFi Beacon signal + DECT Beacon Bluetooth search signal
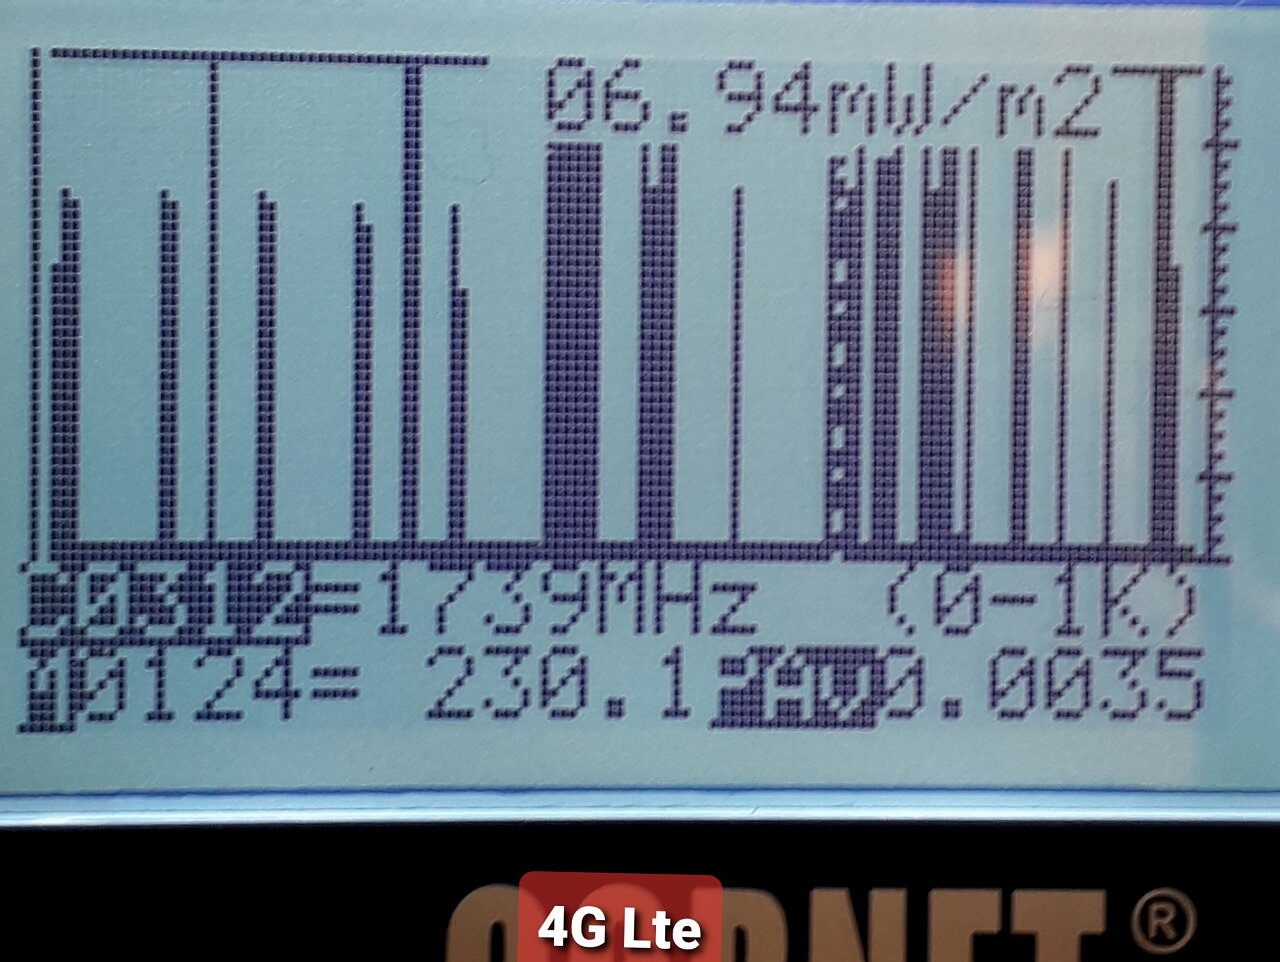
4G LTE mobile phone signal Analog continues 3.49GHz radio signal
1) How to hold the CORNET meter for measurement?
The CORNET meter has three internal sensing antenna built in to measure the received signal; the user should not cover or block the sensor area of the meter while measuring. The location of the sensors is indicated on the meter's back silver label. The CORNET meter is a single axis meter; please rotate the meter to get the maximum reading direction and follow that direction while measuring. (Only a single axis meter can find the direction of the signal source.) The meter has three operation modes (RF, LF Gauss, and LF Electric field); please follow the directions in the picture below while doing the measurement.
2)What is the best measuring distance between the RF source and the meter?
The majority of RF safety standards required a minimum measurement distance of 1 meter or 3 meters from the source of the RF signal; otherwise, the meter will become overloaded (such as RF transmitter or WIFI router which radiates very high RF power from its transmit antenna).
If the meter is placed too close to or right next to the transmit antenna, the frequency counter feature of the meter will also get overloaded.
For mobile phone antenna tower measurement:
The area between 50 and 300 meters from the antenna tower is the one with the largest radiation risk
When the distance was extended, the RF radiation rapidly reduced ( by distance square)
The RF transmit power to the transmit antenna on the tower also affect the radiation level as well.
Radiation power density (mw/m2)= RF transmit power(mw)/4πR2 where:R is distance from RF source
*A highly recommended resource on cell tower radiation may be found at: http://www.buergerwelle.de/assets/files/workshop on cell tower radiation.pdf
3) Accuracy of the meter?
Each CORNET meter is calibrated in our USA lab using certified test equipment before being shipped to our customers.
We also compare the meter's reading to that of an industrial standard certified professional EMF meter from companies like Narda and Smartfield meter to make sure it is correct. The meter store the Calibration data inside the meter's memory, therefore it is not required to re-calibrate the meter from time to time.
4)What is the Maximum frequency the ED88TPlus series meter can operate?
The ED88TPlus5G and ED88TPlus2 meters have an 8GHz specification, but they are found to work up to 11GHz with reduced sensitivity.(Uncalibrated) as a detector purpose, such as detecting a microwave motion sensor for LED light control detection. (For better sensitivity the ED85EXPlus meter with LPDA1810 external antenna unit is recommended)
* Remember that the air loss of a high band microwave signal is very large; most devices at that frequency operate at a signal level of -80dBm to -100dBm; you may need to place the meter very close to the signal source to detect it.
5)What is the Frequency counter function of the ED88TPlus series meter ?
Real time Frequency counter display
The CORNET ED88TPlus series meter is currently the only meter on the market with a built-in frequency display function.
The ED88TPlus series meter's Frequency display function is a real time frequency counter; the meter measures both the RF signal level and the frequency of the received signal at the same time, down to each pulse/burst level ( the pulse/burst can be as short as 100usec).
The ED88TPlus5G frequency counter operates up to 4.2GHz, covering all 5G mobile network frequency bands (except the millimeter wave band), while the ED88TPlus2 and previous models of CORNET meters operate up to 2.7GHz.
Based on the frequency of the signal, the user can determine the source and type of the RF signal.
(for example: Wifi use 2.4GHz, DECT phones use 1.9GHz, 4G cell phones use 1.7GHz-1.9GHz, cordless phones, IOT devices use 900MHz, and 5G mobile network uses 3.5GHz....) Once the signal source type is known, it is very easy to find a way to reduce the RF radiation level.
(*A minimum signal level is required to correctly detect the frequency of the signal.)
6) The difference between RF power (dBm, mw) and RF power density (mw/m2) ?
-The dBm or mw is the unit of the received RF power. (0dBm=1mw)
-The mw/m2 is the unit of the RF power density which is related to the RF field strength.
-The RF power density (mw/m2) is the received RF power (mw) divided by the area (m2) of the the effective area of the meter's receiving antenna.
For example: tne meter's antenna received the RF power of -25dBm, after divided by the effective area of the receiving antenna (m2) we got the power density or field strength of 1.8mw/m2
The effective area of the receiving antenna is different for different antenna or meter design.
If you are measuring RF field strength you use the unit of RF power density (mw/m2)
If you are measuring received RF power you use the unit of RF power (dBm)
*most of the RF engineer uses dBm because the RF transmitter output, antenna loss, on air loss, distance loss, and frequency loss etc., ... are all specified as dB or power of dBm. ( the meter's received RF power is the RF source tranmitted power minues all these loss).
7) Compare Frequency counter to the Spectrum Analyzer?
Spectrum Analyzer problems in modern digital RF environment
The modern digital RF signal utilized in mobile phones, Wifi, and new wireless devices is a pulse/burst kind of RF signal. It transmits signals in extremely short bursts but does not send any signal in between the pulses/bursts; the RF pulse/burst has a very high signal level while bursting, and practically little signal during non-bursting time. The classic scanning method of Spectrum analyzer has a very sluggish scanning speed because it scans each frequency of the covered frequency spectrum step by step. It displays the frequency when the incoming signal frequency is matched with the spot scanning frequency of the Spectrum analyzer.
It is a "Hit or Miss!" procedure. It is fine for old continuous wave analog RF signals, but not for modern digital RF pulse/burst type of signals.
The classic scanning type of Spectrum Analyzer simply cannot record the receiving on and off RF burst in time (It will take several seconds to scan from low frequency of spectrum to high GHz of spectrum in old scanning type of Spectrum analyzer). Because the on-air RF signal is asynchronous to the spectrum analyzer's scanning operation, the Spectrum analyzer will miss burst signals most of time.
The only method to avoid the issues is to repeatedly scan the full frequency spectrum again and again then overlay the findings in the goal of obtaining a complete image of the spectrum of the signal received. Most of the time, this is not very effective because the digital RF transmitted signal bursts are time dependent and never repeat themselves like continues wave analog RF signals, If the Spectrum analyzer fails to capture it at the scanning frequency in time, the RF burst signal is gone and the Spectrum analyzer will never able to capture it again and show the frequency of it.
To solve the problem, modern Real-time Spectrum Analyzer captures sections of the frequency spectrum all at once and then display the spectrum using digital signal processing methods, but it is very expensive and bulky equipment, the bandwidth of the section of frequency that the real-time Spectrum Analyzer can capture each time currently is also very limited.
The slow scan speed of Spectrum analyzer can not capture the fast on/off pulse/burst of the modern digital RF signal in time. The real time frequency counter in the ED88TPlus series of meter is the best solution for the modern digital RF signal problems.
The ED88TPlus5G meter captures signals at a rate of 25000 samples per second, allowing it to record digital RF signal pulses and bursts as short as 100usec. Each pulse/signal burst's level and frequency are recorded in real time. You always get the correct signal level and frequency of the signal pulse/burst.
* (The frequency counter circuit requires a certain minimum signal level to function properly.)
8) 5G mobile frequency indicator?
5G mobile frequency frequency indicator =5G=
The ED88TPlus5G meter frequency counter display supports frequencies up to 4.2GHz. The meter automatically detects the 5G mobile network frequency bands signal and displays a =5G= mark on the display to indicate the detection of the 5G mobile network frequency. (5G channel n5, n71, n77, and n78)
(*A minimum signal level is required to correctly detect the 5G signal.)
9) How to use the ED88TPlus5G to measure the 5G signal?
The 5G mobile network can transmit data at super-fast speeds. However, it consumes a lot of bandwidth from the system, limiting the number of services that can be provided at the same time. There are two types of 5G network systems: SA (standalone) and NSA (no-standalone). The SA system employs a pure 5G network system and frequency. The NSA system combines the older 4G-LTE system and frequency with the new 5G network system and frequency as a hybrid system.
Because the SA system is very expensive, 99 percent of the world's 5G mobile networks are now using the NSA 5G system..
When a mobile handset attempts to connect to a 5G antenna tower-based station, the NSA 5G system uses the older 4G-LTE frequency band for the protocol handshaking phase. and it only transmits super high-speed data using the 5G system/frequency band during the 5G data download phase. It is done dynamically. If the based station decides that the 5G signal is not good enough or is too busy, the NSA 5G system may not use the 5G system/frequency at all in the data download phase of transmission. Instead, it may use the older 4G-LTE system/frequency for data download phase transmission. As a result, the 5G network signal will not be visible in the NSA 5G system all the time.
You may not be able to detect the 5G signal/frequency in front of the 5G antenna tower in the NSA 5G system, unless someone in the area is using the 5G phone talking to the antenna tower base station, and is in the 5G data download phase using the 5G signal/frequency.
The ED88TPlus5G has a built-in frequency counter and 5G frequency indicator that supports all 5G frequency bands*. It will detect and display the 5G signal frequency when the NSA 5G system transmits the 5G signal with the 5G frequency during the 5G super high speed data download phase.
Other meters without a frequency counter function will not be able to tell you whether you are measuring an old 4G/LTE signal or a new 5G signal.
*except the millimeter wave band
10) Statistical Data & Realtime signal waveform window of the received RF signal in ED88TPlus5G & ED88Plus5G2?
Modern digital RF signals are pulse/burst signals with a very high on-time burst signal and almost no signal in non-bursting time. It is different from the traditional continuous wave analog type of RF signal.
Today, the majority of wireless devices use digital RF signals.
The "Average value" of the signal level used by the transitional EMF meter or RF power meter to display the level of a continuous wave RF signal does not work well for modern digital RF signals, because the digital RF signal changes on and off so fast that the "average value" can no longer show the actual behavior of the signal measured.
The majority of the professional RF power meter is now operate in peak power meter mode. It displays the peak level of the RF pulse/burst signal. EMF safety research is also expanding into the digital RF field.
Is the peak value is good enough for the modern digital RF signal measurement?
Since the ED15 meter, the CORNET meter has been a peak power meter. But, is the peak value reading adequate for modern digital RF measurement? The answer is no, not really! The modern digital RF signal burst is changing so fast that you can have several thousands of RF burst signals coming during the standard 0.5sec LCD screen update period. A single peak value of an RF pulse/burst signal among thousands of pulse/burst signals cannot represent the true behavior of the received signal. It required Statistical data from all of these thousands of pulse/burst signals to show the actual behavior of the received signal.
(* Why is the screen updating time 0.5 seconds? It is the shortest amount of time that the human eye can keep up with the fast-changing reading on the LCD display screen. You can't read it well if the screen updates faster than 0.5 seconds.)
1) The ED88TPlus5G meter samples the signal at a rate of 25000 samples per second, with 12500 samples available for each 0.5second screen update period. 12500 samples are divided into seven bins (+5 to -5dBm, -5 to -15dBm, -15 to -25dBm, -25 to -45dBm, -45 to -55dBm, -60 to -65dBm). It shows the actual real-time signal level distribution within 0.5 seconds and is very useful for analyzing digital RF signals with short burst/pulse ON-time signals and long zero/very low level OFF-time signals.
The 7 sample bins are organized according to the SBM2008 exposure recommendation, and the calculated Peak Value, Whole Average Value, Peak Average Value, MAX value, and Average Pulse-power value are also shown on the same display window.
(* The Average Pulse-power value is the average of all signals above the -60dBm threshold level (0.0005mw/m2, "slight concern" based on the SBM2008) ; it is the average ON-time power of all RF burst/pulse for digital burst/pulse type of RF signal).
For example: in the graph below, 9832 samples are below -60dBm and 50 samples are between -25dBm and -45dBm.
(*The number in the Statistical bins is scaled down by 1.25 to get a total of 10000 for 7 bins, so the user can calculate the percentage of signals in each level bin by dividing the number by 100, or simply ignore the last two digits of the number.)
As a result, 0.5 percent of the time the RF pulse/burst signal level is greater than -45dBm (SBM2008 exposure 0.01mw/m2 limit "high concern") and 98.3 percent of the time it is less than -60dBm (0.0005mw/m2, "slight concern" based on the SBM2008). This tell you that 98.3% of the time the RF radiation level is in the "slight concern" level (based on the SBM2008 recommendation), and only 0.5% of time it is in the high concern level. This is the information the information the EMF experts are looking for.
ED88TPlus5G Statistical data display
2) The ED88TPlus5G2 meter has additional Realtime signal waveform display of the detected signal with the Statistical data information. The realtime signal waveform is sampled at 42usec/sample and displayed in the Statistical data window with 500usec/step for 0.5sec. display update time. From the realtime signal waveWiFi Beacon signalform display the user can see the actual signal captured with the measured signal level and frequency. This is very important for identifing the digital RF burst type of signal used by 5G/4G LTE mobile phone, Wifi, DECT, Bluetooth...etc., devices to apply shielding solutions for safety purpose.
ED88TPlus5G2 Realtime signal waveform and Statistical data display
3) Typical Realtime digital RF waveform captured by ED88TPlus5G2
DECT Beacon signal every 10ms Microwave oven heating bursts
WiFi Beacon signal every 100ms WiFi Data frame signal with WiFi Beacon
WiFi Beacon signal + DECT Beacon Bluetooth search signal
4G LTE mobile phone signal Analog continues 3.49GHz radio signal
How to access and use the Statistical data in ED88TPlus5G/ ED88TPlus5G2
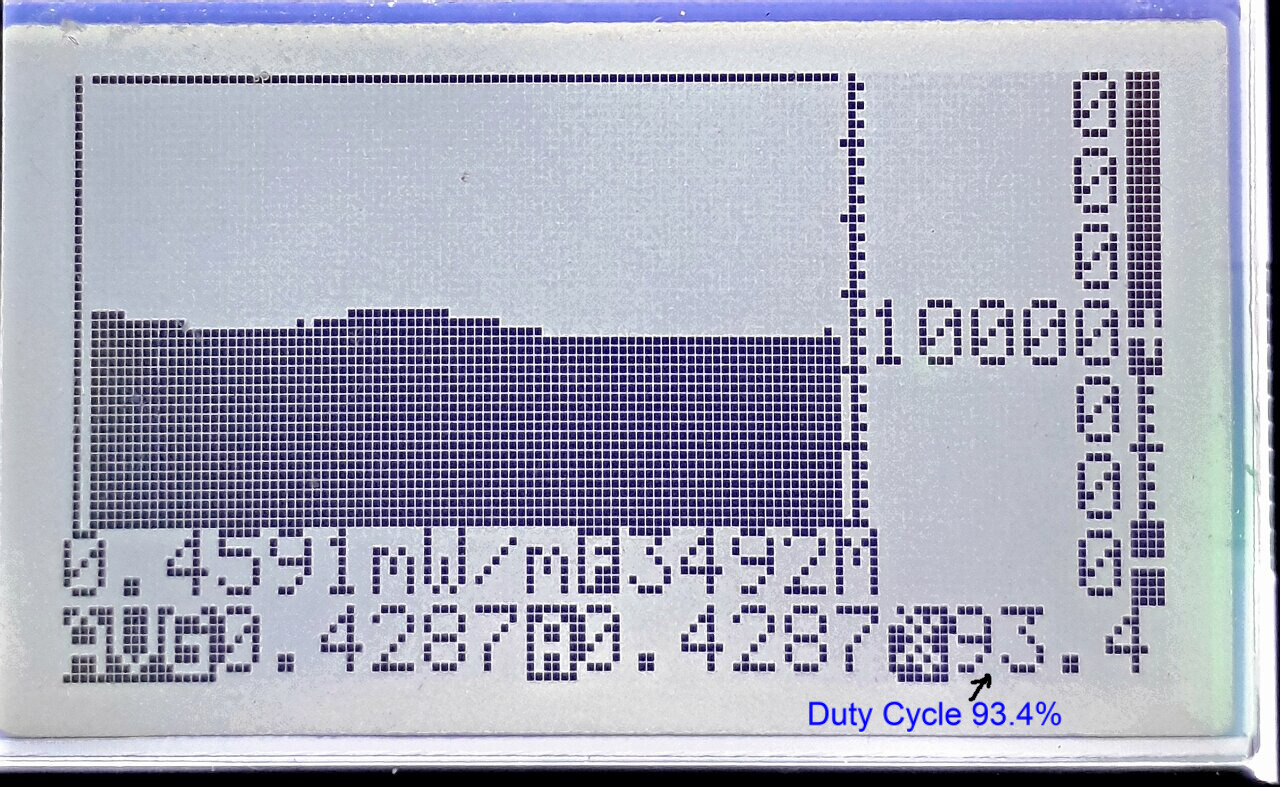
Very easy and simple! With just one easy click, the ED88TPlus5G/ED88TPlus5G2 offers statistical information for all received signals. A single button click reveals the statistical data of every signal received in the past 0.5 seconds when the ED88TPlus5G/ED88TPlus5G2 displays the measurement results on the LCD display. The distribution of the ED88TPlus5G/ ED88TPlus5G2 12000 sample data is displayed in 7 level bins, and the signal's peak value is also displayed as a Big character (based on the SBM2008 recommendation). For digital RF signal types, the duty cycle of the signal is also shown. By examining the distribution of the 12000 sampled data points in the Statistical data window, you can decide whether the signal warrants high worry or not.
The realtime waveform display of the Statistic data window in the ED88TPlus5G2 provides additional information of the signal detected. Together with signal level, Frequency, Duty Cycle, and other informations the user can determine the signal type and evaluate the safety concern of the signals.
For example, if the signal is a beacon signal with a very short duty cycle, it may be less of a concern than a continuous signal. To silence WiFi beacon signals, simply disable the beacon signal setup (SSID broadcast) in the WiFi router configuration. Disabling the Bluetooth search function in mobile devices reduces unnecessary RF signal radiation. Move the DECT phone base unit to a less frequently used location to reduce the Beacon signal radiation level in the common used area, ...etc.,
The ED88TPlus5G2 Realtime waveform display and Statistic data window provides the Informations that is only available from expensive professional equipment.
11) Light Flicker mode of ED98QPro5G
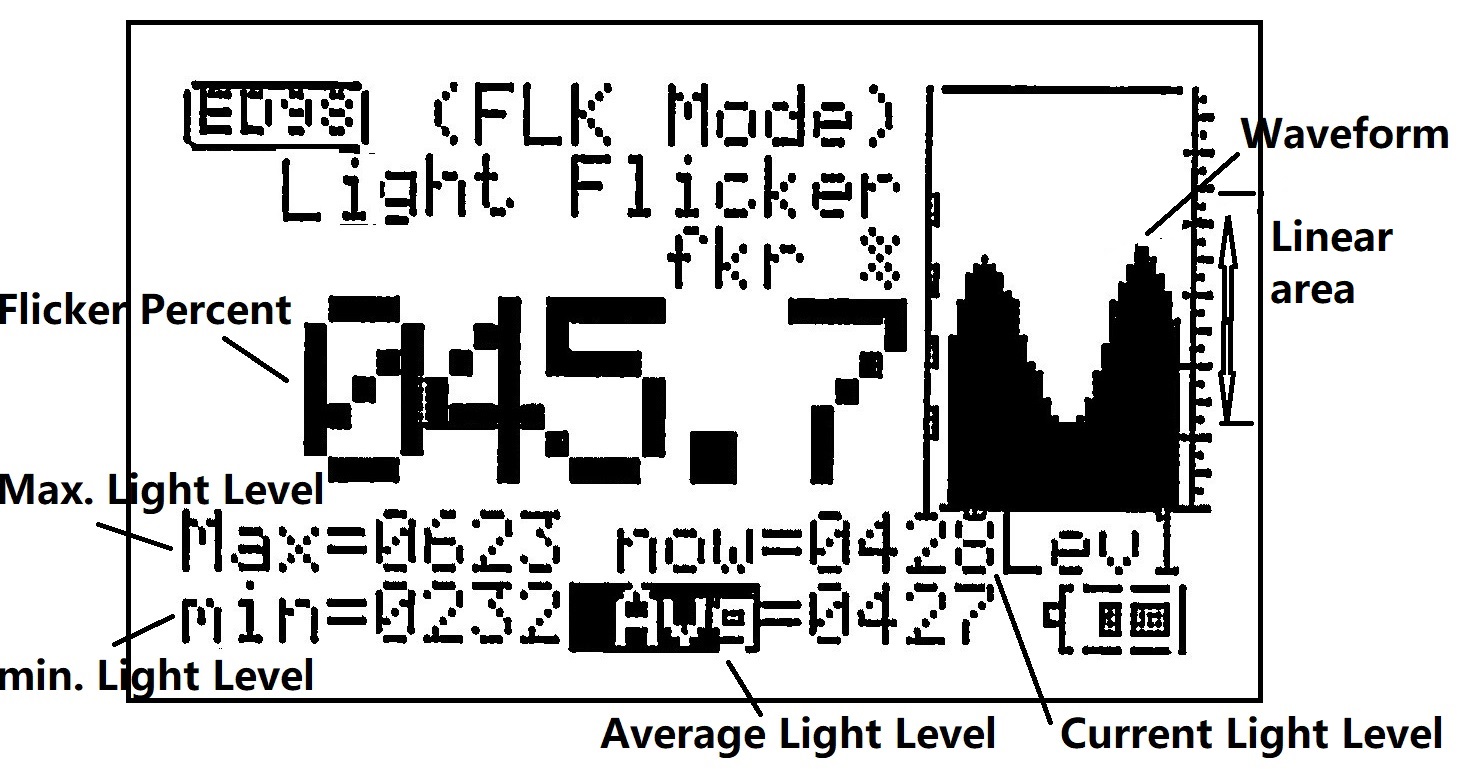
A light flicker meter, also known as a flickermeter or flicker analyzer, is a device used to measure and analyze the flickering of light sources. It is commonly used in various industries, including lighting design and testing, film and television production, and health and safety assessments.
Light flicker occurs when the intensity of light from a source fluctuates rapidly, usually due to variations in voltage or changes in the electrical current powering the light. This flicker can be perceived by the human eye and can cause discomfort, eye strain, and even health issues.
A light flicker meter measures and quantifies the flickering of light sources, providing objective data that can be used to assess the quality of light and its potential impact on human health and well-being. It typically measures parameters such as light intensitivity, flicker index, or flicker percentage, which indicate the severity of flickering. This data can be used to compare different light sources, identify potential issues or improvements, and ensure compliance with industry standards and regulations.
The ED98QPro5G meter's Light Flicker mode is simple to use; simply point the light sensor at the top of the meter toward the light source, and the LCD display will show the real-time Light Flicker rate and waveform of the light intensitivity.
Some advanced flicker meters may also offer additional features, such as real-time monitoring, data logging, and compatibility with specific lighting technologies or communication protocols.
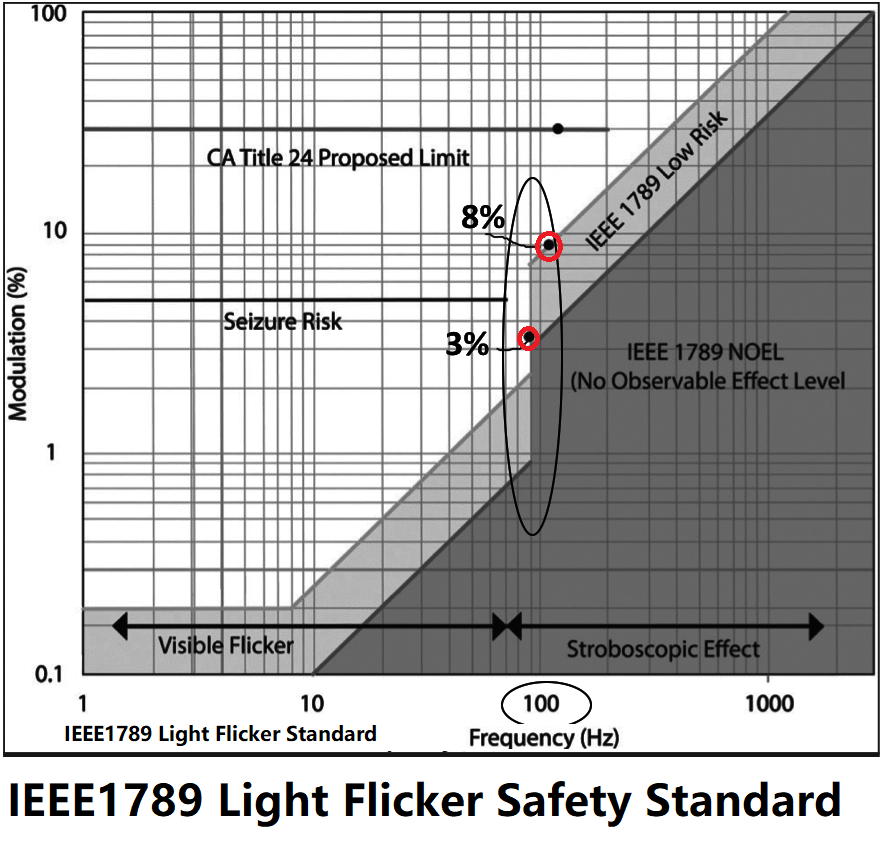
IEEE 1789 is a standard issued by the Institute of Electrical and Electronics Engineers (IEEE) that focuses on the assessment of flicker and its effects on humans. It provides guidelines for measuring and evaluating the potential harmful effects of flicker in lighting systems, especially those using LED technology.
The standard sets limits for flicker parameters such as flicker perception, flicker strength, and flicker density to ensure that lighting systems do not pose any unacceptable risks to human health and well-being. It also provides methods for measuring and assessing flicker in both steady-state and transient conditions.
By following the guidelines of IEEE 1789, manufacturers and designers can produce lighting products that are less likely to cause discomfort, fatigue, or adverse health effects due to flicker. This standard is particularly important in applications where lighting systems are used for prolonged periods, such as in offices, schools, and homes. (The 8% Flicker rate is the safe limit for high Flicker in 100-120Hz range which is must common flicker frequency from lighting fixtures)
In recent years, there has been increased attention to the potential health effects of flicker, especially as LED lighting technology has become more prevalent. IEEE 1789, UL optical light flicker certification, EU COMMISSION REGULATION (EU) 2019/2020 on eco-design requirements for lighting products, aims to address these concerns and provide a unified framework for assessing flicker in lighting systems.
Light flickering can have various impacts on health:
1. Eye strain: Rapid variations in light intensity can induce eye strain and tiredness, resulting in symptoms such as headaches, dry eyes, and blurry vision.
2. Discomfort and annoyance: Flickering lights can be bothersome and irritating, leading to discomfort and tension.
3. Disruption of sleep patterns: Flickering lights, particularly at night, can disrupt sleep patterns, making it harder to fall or stay asleep.
4. Photosensitive epilepsy: A small number of persons with photosensitive epilepsy may have seizures caused by specific light patterns or flickering.
5. Migraine triggers: For some people who suffer from migraines, flickering lights can be a trigger and worsen their headache symptoms.
There can be several reasons for LED light flickering, including:
(1)Incompatible Dimming Systems: Some LED lights are not compatible with certain types of dimmers, leading to flickering. This can happen if the dimmer is designed for incandescent or halogen lights, which have different electrical characteristics than LEDs.
(2)Voltage fluctuations: Sudden changes in voltage supply can cause LED lights to flicker. This can occur due to inadequate wiring or power quality issues in the electrical circuit.
(3)Low-quality LED lights: Cheap or low-quality LED lights may have poor drivers or electronic components, which can result in flickering issues.
Overheating: When an LED light heats up excessively, it can cause the electronics inside to malfunction temporarily, leading to flickering.
(4)Loose connections: Poor electrical connections between the LED driver, power supply, or wiring can cause voltage drops and result in flickering.
To address LED light flickering, it is important to identify the root cause and take appropriate action. This may involve:
(5)Using the correct dimmers: Ensure that the dimmer switch is compatible with LED lights and properly matched to the electrical load.
(6)Stabilizing power supply: Install voltage stabilizers or power conditioners to minimize voltage fluctuations and stabilize the power supply.
(7)Upgrading to higher-quality LED lights: Good-quality LED lights from respected manufacturers are less prone to flicker. Choose UL certified flicker-free light bulbs.
(8)Proper installation: Make sure the LED lights are installed appropriately, according to the manufacturer's instructions and using proper wiring techniques.
Typical Light Flicker of different lighting sources:
| Light Source |
Flicker % |
| Incandescent light bulb |
4% |
| Metal Halide/magnetic ballast |
48% |
| T12 Fluorescent /magnetic ballast |
35% |
| CFL Fluorescent /Electronic ballast |
2 to 3% |
| Halogen lamp |
2% |
| Dimable LED lamp (PWM type) |
20% |
| DC LED lamp 5V |
1 to 2% |
| AC LED lamp 110V cheap quality |
15% |
| AC LED lamp 110V UL certified |
1% |
| LED shop light T12 110V AC |
25% |
| LED light strip 110V AC |
15% |
| LED desk light 110V AC |
7 to 15% |
| LED light bulb 110V AC average quality |
7 to 12% |
More information:
Links to US Department of Energy "Light Flicker-Basic" training video (https://www.energy.gov/eere/ssl/flicker-basics)